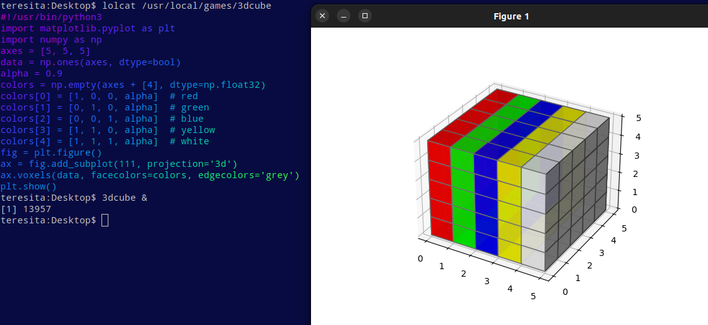
#!/usr/bin/python3
import matplotlib.pyplot as plt
import numpy as np
axes = [5, 5, 5]
data = np.ones(axes, dtype=bool)
alpha = 0.9
colors = np.empty(axes + [4], dtype=np.float32)
colors[0] = [1, 0, 0, alpha]  # red
colors[1] = [0, 1, 0, alpha]  # green
colors[2] = [0, 0, 1, alpha]  # blue
colors[3] = [1, 1, 0, alpha]  # yellow
colors[4] = [1, 1, 1, alpha]  # white
fig = plt.figure()
ax = fig.add_subplot(111, projection='3d')
ax.voxels(data, facecolors=colors, edgecolors='grey')
plt.show()
About Linuxgal
Need a spiritual home? Consider joining us at Mary Queen of the Universe Latter-day Buddhislamic Free Will Christian UFO Synagogue of Vishnu