
Closing in on a square wave with the Fourier series under Python
#!/usr/bin/env python3
import numpy as n,matplotlib.pyplot as p
x=n.linspace(0,2*n.pi,1000)
def s(x,t):
    k=n.arange(1,2*t,2)
    return 4/n.pi*(n.sin(k[:,None]*x)/k[:,None]).sum(0)
N=12
colors=p.cm.rainbow(n.linspace(0,1,N))
for i,t in enumerate(range(1,N+1)):
    p.plot(x,s(x,t),color=colors[i],label=f'{2*t-1} harmonics')
p.title('Fourier Series Approximation of a Square Wave')
p.grid()
p.legend()
p.show()
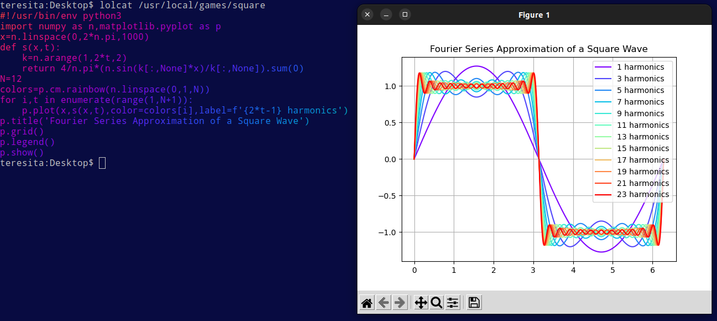

 Terminal Cruise