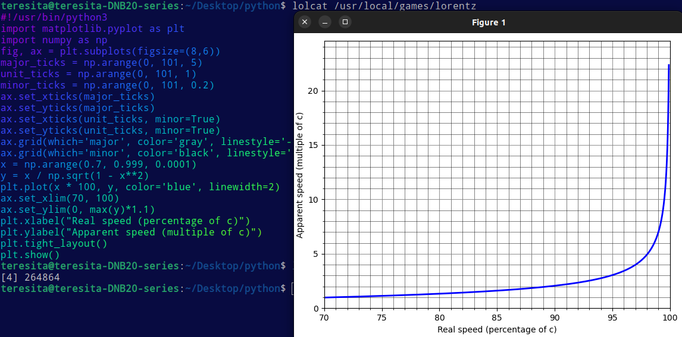
Using Python to graph relativistic apparent speed as a starship approaches c
#!/usr/bin/python3
import matplotlib.pyplot as plt
import numpy as np
fig, ax = plt.subplots(figsize=(8,6))
major_ticks = np.arange(0, 101, 5)
unit_ticks = np.arange(0, 101, 1)
minor_ticks = np.arange(0, 101, 0.2)
ax.set_xticks(major_ticks)
ax.set_yticks(major_ticks)
ax.set_xticks(unit_ticks, minor=True)
ax.set_yticks(unit_ticks, minor=True)
ax.grid(which='major', color='gray', linestyle='-', linewidth=0.8, alpha=0.8)
ax.grid(which='minor', color='black', linestyle='-', linewidth=0.5, alpha=0.7)
x = np.arange(0.7, 0.999, 0.0001)
y = x / np.sqrt(1 - x**2)
plt.plot(x * 100, y, color='blue', linewidth=2)
ax.set_xlim(70, 100)
ax.set_ylim(0, max(y)*1.1)
plt.xlabel("Real speed (percentage of c)")
plt.ylabel("Apparent speed (multiple of c)")
plt.tight_layout()
plt.show()
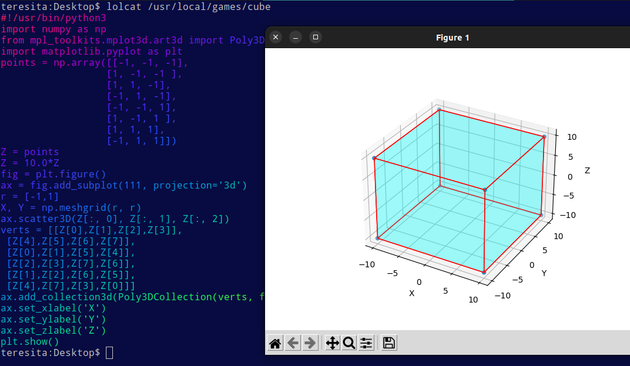
Plot a cube.
#!/usr/bin/python3
import numpy as np
from mpl_toolkits.mplot3d.art3d import Poly3DCollection, Line3DCollection
import matplotlib.pyplot as plt
points = np.array([[-1, -1, -1],
[1, -1, -1 ],
[1, 1, -1],
[-1, 1, -1],
[-1, -1, 1],
[1, -1, 1 ],
[1, 1, 1],
[-1, 1, 1]])
Z = points
Z = 10.0*Z
fig = plt.figure()
ax = fig.add_subplot(111, projection='3d')
r = [-1,1]
X, Y = np.meshgrid(r, r)
ax.scatter3D(Z[:, 0], Z[:, 1], Z[:, 2])
verts = [[Z[0],Z[1],Z[2],Z[3]],
[Z[4],Z[5],Z[6],Z[7]],
[Z[0],Z[1],Z[5],Z[4]],
[Z[2],Z[3],Z[7],Z[6]],
[Z[1],Z[2],Z[6],Z[5]],
[Z[4],Z[7],Z[3],Z[0]]]
ax.add_collection3d(Poly3DCollection(verts, facecolors='cyan', linewidths=1, edgecolors='r', alpha=.20))
ax.set_xlabel('X')
ax.set_ylabel('Y')
ax.set_zlabel('Z')
plt.show()
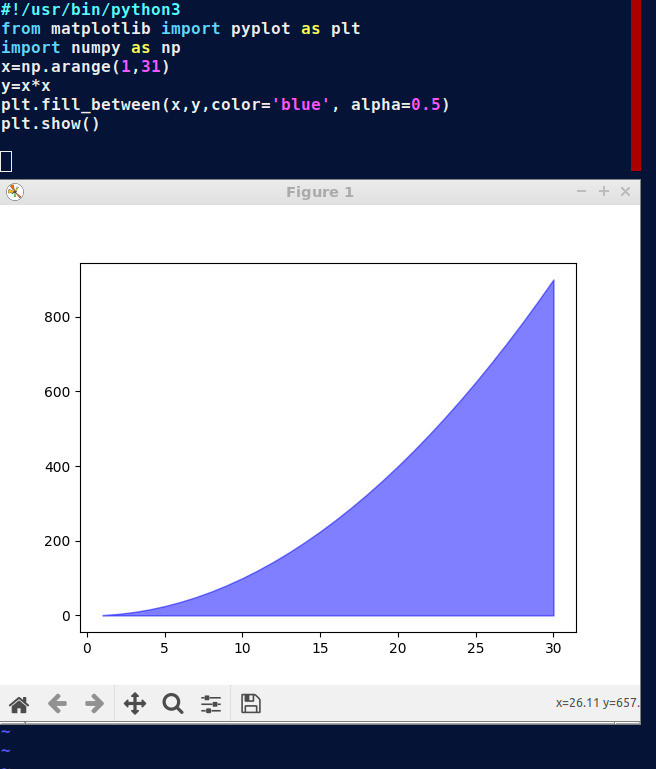
Plot the area under a curve with Python
#!/usr/bin/python3
from matplotlib import pyplot as plt
import numpy as np
x=np.arange(1,31)
y= x * x
plt.fill_between(x,y,color='blue', alpha=0.5)
plt.show()
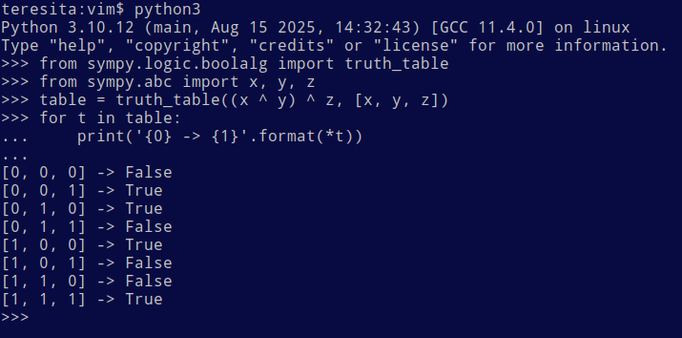
Generating truth tables
from sympy.logic.boolalg import truth_table
from sympy.abc import x, y, z
table = truth_table((x ^ y) ^ z, [x, y, z])
for t in table:
    print('{0} -> {1}'.format(*t))