
Y0
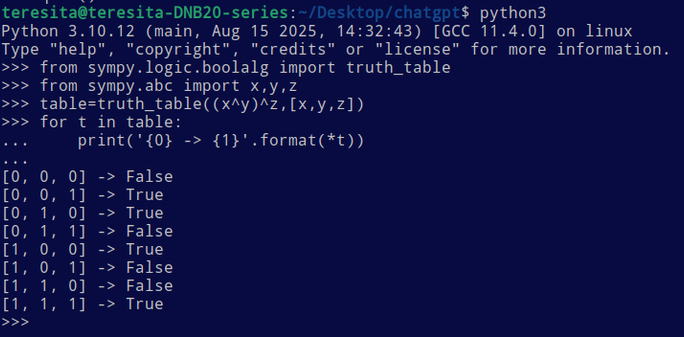
Truth tables in Python
from sympy.logic.boolalg import truth_table
from sympy.abc import x, y, z

table = truth_table((x ^ y) ^ z, [x, y, z])
for t in table:
    print('{0} -> {1}'.format(*t))
Y1
Use awk to make your Mastodon follow list into an RSS feed
awk -F'[@,]' '{print "https://" $2 "/@" $1 ".rss"}' following_accounts.csv

Y2
Ares: “Xena, what’s your sign?”
Xena: “Do not Enter”
Ares: “Hey, come on, we’re both here at this bar for the same reason.”
Xena: “Yeah! Let’s pick up some chicks!”
Ares: “I know how to please a woman.”
Xena: “Then please leave me alone.”
Ares: “I want to give myself to you.”
Xena: “Sorry, I don’t accept cheap gifts.”
Ares: “I can tell that you want me.”
Xena: “Ohhhh. You’re so right. I want you to leave.”
Ares: “If I could see you naked, I’d die happy.”
Xena: “Yeah, but if I saw you naked, I’d probably die laughing.”
Ares: “Your body is like a temple.”
Xena: “Sorry, there are no services today.”
Ares: “I would go to the end of the world for you.”
Xena: “Yes, but would you stay there?”
Ares: “Your place or mine?”
Xena: “Both. You go to yours and I’ll go to mine.”
Ares: “How do you like your eggs in the morning?”
Xena: “Unfertilized!”

Y3

Y4

Y5

Y6

Y7
Generating contour maps with Python
#!/usr/bin/python3
import matplotlib.pyplot as plt
import numpy as np
# Grid
X, Y = np.meshgrid(np.linspace(-4, 4, 512), np.linspace(-4, 4, 512))
# Base function with slight asymmetry
Z = (1 – X/2 + X**4 + Y**3) * np.exp(-X**2 – Y**2) * (1 – X/3 – Y**4) * (3 – Y + X**2)
# Lower-frequency smooth perturbation
Z += 0.5*np.sin(0.8*X + 0.6*Y) + 0.4*np.cos(0.5*X – 0.7*Y) + 0.3*np.sin(0.6*X – 0.4*Y)
# Contour levels
levels = np.linspace(np.min(Z), np.max(Z), 25)
# Plot
fig, ax = plt.subplots()
ax.contour(X, Y, Z, levels=levels, cmap=’terrain’)
plt.show()
Y8

Y9
Building a square wave with a Fourier series of odd harmonics under Python
#!/usr/bin/python3
import numpy as np
import matplotlib.pyplot as plt
x = np.linspace(0, 2*np.pi, 1000)
def square_wave_series(x, n_terms):
    y = np.zeros_like(x)
    for k in range(1, n_terms+1):
        n = 2*k - 1   # odd numbers: 1,3,5,...
        y += np.sin(n*x)/n
    return (4/np.pi) * y
colors = ["blue", "green", "yellow", "orange", "red"]
for i, n in enumerate([1, 2, 3, 4, 5]):
    y = square_wave_series(x, n)
    plt.plot(x, y, color=colors[i], label=f"{2*n-1} harmonics")
plt.legend()
plt.title("Fourier Series Approximation of a Square Wave")
plt.grid(True)
plt.show()

YA
Print all the four letter words in the Bible:
perl -ne 'for(/\w+/g){$w=lc; $seen{$w}=1 if length$w==4} END{print"$_ " for sort keys %seen}' kjv.txt

YB
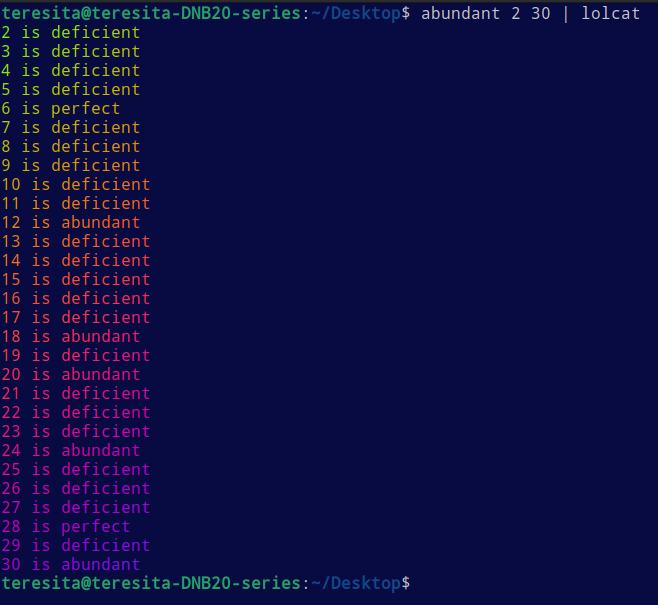
Abundant, perfect, and deficient numbers with Python
#!/usr/bin/python3

import sys; beg,end=int(sys.argv[1]),int(sys.argv[2]);[print(f"{n} is "+("perfect" if (s:=sum(x for x in range(1,1+n//2) if n%x==0))==n else "abundant" if s>n else "deficient")) for n in range(beg,end+1)]
YC
Lagrange Points L1, L2, and L3 all lie on the line that passes through the Earth and Moon. L1 is between the Earth and Moon, so it is a great place to build a communications relay. L2 is behind the Moon, so it is a great place to build a radio telescope immune to any interference from the noisy radio chatter of the Earth. From L3, the Earth will always block the view of the Moon, so the joke goes that L3 is a great place to build an orbiting hospital to treat people with lycanthropy.

YD
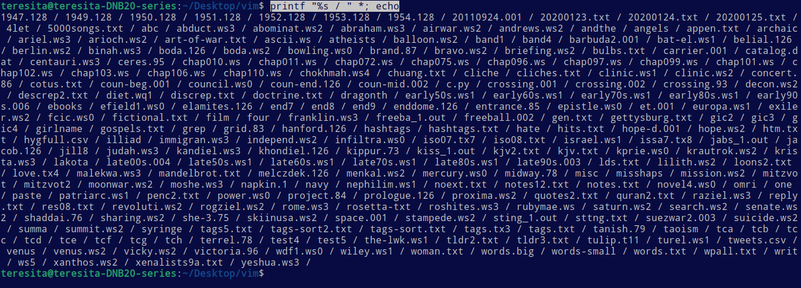
Display the contents of a large directory without line breaks:
printf "%s / " *; echo
YE
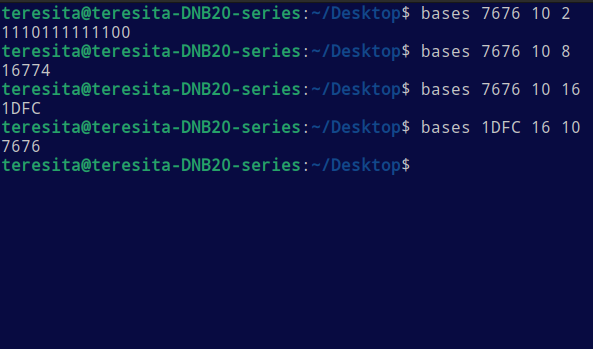
Convert between numerical bases with impunity:
#!/bin/bash

num=$1

from=$2

to=$3

dec=$(echo "ibase=$from; $num" | bc)

conv=$(echo "obase=$to; $dec" | bc)

echo "$conv"
YF
Use Python to find the positive local minimum of the gamma function:
#!/usr/bin/env python3
import numpy as np
from scipy.special import gamma
from scipy.optimize import minimize_scalar

# Interval near origin for first local minimum
a, b = 0.1, 2.0
n_iter = 25  # number of iterations to display

# Golden-section search manually to control iteration printing
phi = (1 + 5**0.5) / 2
invphi = phi - 1  # 1/phi

# Initial points
c = b - invphi * (b - a)
d = a + invphi * (b - a)
fc, fd = gamma(c), gamma(d)

print(f"{'Iter':>4} {'x':>12} {'gamma(x)':>12}")
for i in range(1, n_iter + 1):
    if fc < fd:
        b, d, fd = d, c, fc
        c = b - invphi * (b - a)
        fc = gamma(c)
        x_min = c
        f_min = fc
    else:
        a, c, fc = c, d, fd
        d = a + invphi * (b - a)
        fd = gamma(d)
        x_min = d
        f_min = fd
    print(f"{i:4d} {x_min:12.8f} {f_min:12.8f}")

print(f"\nLocal minimum approx: x = {x_min:.10f}, gamma(x) = {f_min:.10f}")
#!/usr/bin/env python3
import numpy as np
import matplotlib.pyplot as plt
from scipy.special import gamma

# Interval near the origin
x = np.linspace(0.1, 2.0, 500)
y = gamma(x)

# Approximate minimum from your iterations
x_min = 1.461632 # from your 25-iteration run
y_min = gamma(x_min)

plt.figure(figsize=(8,4))
plt.plot(x, y, label="gamma(x)")
plt.axvline(x_min, color='red', linestyle='--', label=f"Min near x={x_min:.6f}")
plt.scatter(x_min, y_min, color='red')
plt.title("Gamma function near its first local minimum")
plt.xlabel("x")
plt.ylabel("gamma(x)")
plt.grid(True)
plt.legend()
plt.tight_layout()
plt.show()

YG
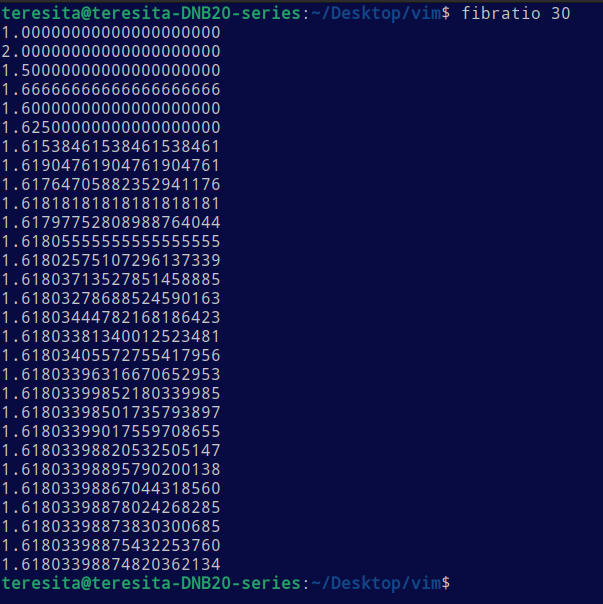
Shell function to calculate the ratio of neighboring Fibonacci numbers (φ) with recursion without exponential blow-up:
fibratio ()

{

echo "define f(n){auto a,b,t,i;a=0;b=1;for(i=2;i<=n;i++){t=a+b;a=b;b=t};if(n==0)return 0;return b};for(i=2;i<=$1;i++) print f(i)/f(i-1),\"\n\"" | bc -l

}
YH
Get a count of each word in the Bible with awk
awk '{for(i=1;i<=NF;i++){w=tolower($i); gsub(/[^a-z]/,"",w); if(w!="") count[w]++}}END{for(w in count) print count[w], w | "sort -nk1"}' kjv2.txt

YI
Print every word in the Bible that follows ‘thou shalt not’ with awk
awk '{n=split(tolower($0),a,"thou shalt not "); if(n>1){split(a[n],b,/[^a-z]+/); print b[1]}}' kjv.txt | sort -u

YJ
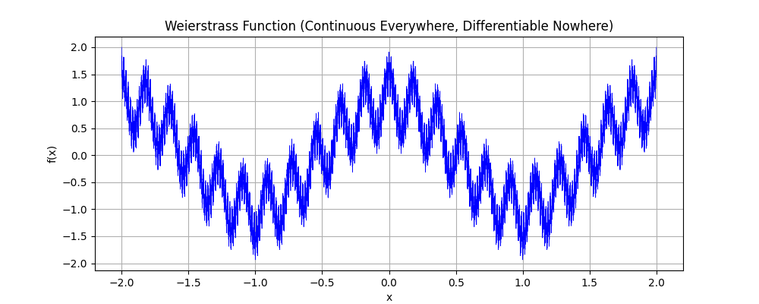
The Weierstrass monster with Python
#!/usr/bin/python3
import numpy as np
import matplotlib.pyplot as plt

# Parameters
a = 0.5        # 0 < a < 1 b = 11 # odd integer, large enough that ab > 1+3pi/2
n_terms = 50   # number of terms in the series
x = np.linspace(-2, 2, 20000)

# Compute the Weierstrass function
f = np.zeros_like(x)
for n in range(n_terms):
    f += a**n * np.cos(b**n * np.pi * x)

# Plot
plt.figure(figsize=(10,4))
plt.plot(x, f, color='blue', linewidth=0.5)
plt.title("Weierstrass Function (Continuous Everywhere, Differentiable Nowhere)")
plt.xlabel("x")
plt.ylabel("f(x)")
plt.grid(True)
plt.show()
YK
Build a list of unique words from a text file
tr -cs '[:alpha:]' '\n' < gettysburg.txt | tr '[:upper:]' '[:lower:]' | sort -u

YL
Calculate parallel resistance (or series capacitance) for any number of discrete components with Python
python3 -c "import sys; print(f'{1/sum(1/float(x) for x in sys.argv[1:]):.2f}')" 1800 2700 3300

YM
python3 -c "import sys; [sys.stdout.write(''.join(chr((ord(c)-84)%26+97 if c.islower() else (ord(c)-52)%26+65 if c.isupper() else ord(c)) for c in line)) for line in sys.stdin]"

YN

YO
I AM LEIA OF BORG. I’d rather assimilate a Wookie!
WE ARE PINK FLOYD OF BORG: We don’t need no assimilation. All in all, we’re just Borgs in the wall.
I AM ANDY ROONEY OF BORG: Ever wonder why resistance is futile?
I AM 007 OF BORG: You will be shaken, not assimilated.
I AM COOL HAND OF BORG: What we have here is a failure to assimilate!
I AM POPE LEO OF BORG: Resistance is irreverent!
I AM ROCKNE OF BORG: Go out there and assimilate one for the Gipper!
I AM C-3PO OF BORG: I am fluent in over 6 million forms of assimilation.
I AM VADER OF BORG: You will be assimilated. The Collective has foreseen it. Resistance is futile. It is your destiny.
I AM FRANK SINATRA OF BORG: Your way is irrelevant. You will be assimilated my way.
I AM DAFFY DUCK OF BORG: You – You – Yooourrrr’e Irrelevant!
I AM MR. T OF BORG: I pity da fool that resists me! You gonna be assimilated, sucka!
I AM MR. ROGERS OF BORG: It’s a beautiful day in the Collective. Can you say assimilate, boys and girls?
YP
The Shining (1980) – The management of the Timberline Lodge requested that Kubrick not use room 217 (as specified in the book), fearing that nobody would want to stay in that room ever again. Kubrick changed the script to use the nonexistent room number 237.

YQ

YR

YS
Linux Novice – Someone who wonders what RTFM means.
Linux User – Someone who has tried to RTFM.
Windows User – Someone who has never heard RTFM.
Linux Guru – Someone who doesn’t need to RTFM.
Linux Hacker – Someone who knows what isn’t in TFM.
Linux Jedi – The one who WTFM

YT
Steve Hanks Art

YU
God said the Fruit of the Knowledge of Good and Evil will be fatal within 24 hours of ingestion. Snake said, “You will not die” and further claimed the fruit would confer an innate sense of ethics. Eve used herself as the test subject in the world’s first human pharmacological trial, and asked Adam to participate in the research to rule out any sex-based differences in the effect of the fruit. Her conclusion was that the claim of Snake was the more accurate one, but the low sample size made the error bars in the graph unacceptably large.

YV
Women come off pretty good in Genesis starting with Eve the first scientist (“‘In the day you eat thereof you shall surely die?’ Really?), Hagar, who was the whole story of Exodus embodied and foreshadowed, Rebekah the idea gal, mistress of stagecraft, Rachel, who smuggled out her father’s gods by relying on the ick factor, Tamar the poker player, who even while pregnant raised and made Judah fold, turning what could have been a capital case into a public moral judgment that she wins.

YW
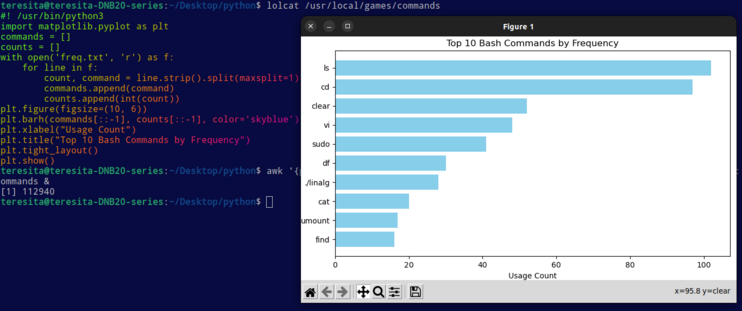
$ awk '{print $1}' ~/.bash_history | sort | uniq -c | sort -nr | head -10 > freq.txt && commands &
(Calls the following executable Python script named “commands”):
#! /usr/bin/python3
import matplotlib.pyplot as plt
commands = []
counts = []
with open('freq.txt', 'r') as f:
    for line in f:
        count, command = line.strip().split(maxsplit=1)
        commands.append(command)
        counts.append(int(count))
plt.figure(figsize=(10, 6))
plt.barh(commands[::-1], counts[::-1], color='skyblue')
plt.xlabel("Usage Count")
plt.title("Top 10 Bash Commands by Frequency")
plt.tight_layout()
plt.show()
YX
Plot the upper half of the unit circle with Python
Plot the upper half of the unit circle with Python
#! /usr/bin/python3

import numpy as np

import matplotlib.pyplot as plt

x = np.linspace(-1, 1, 500)

y = np.sqrt(1 - x**2)

plt.plot(x, y, label=r'$y = \sqrt{1 - x^2}$', color='blue')

plt.fill_between(x, y, color='lightblue', alpha=0.5)

plt.title('Area Under $y = \sqrt{1 - x^2}$')

plt.xlabel('x')

plt.ylabel('y')

plt.axis('equal')

plt.grid(True)

plt.legend()

plt.show()

YY

YZ

