
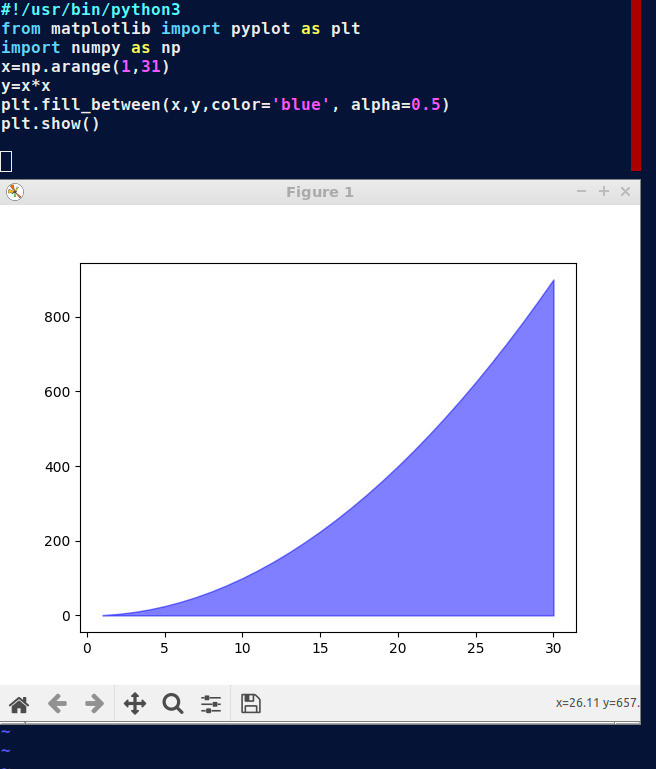
Plot the area under a curve with Python
#!/usr/bin/python3
from matplotlib import pyplot as plt
import numpy as np
x=np.arange(1,31)
y= x * x
plt.fill_between(x,y,color='blue', alpha=0.5)
plt.show()
Plot the area under a curve with Python
#!/usr/bin/python3 from matplotlib import pyplot as plt import numpy as np x=np.arange(1,31) y= x * x plt.fill_between(x,y,color='blue', alpha=0.5) plt.show()
